專注Java教育14年
全國咨詢/投訴熱線:400-8080-105
更新時間:2021-11-18 10:37:34 來源:動力節點 瀏覽1582次
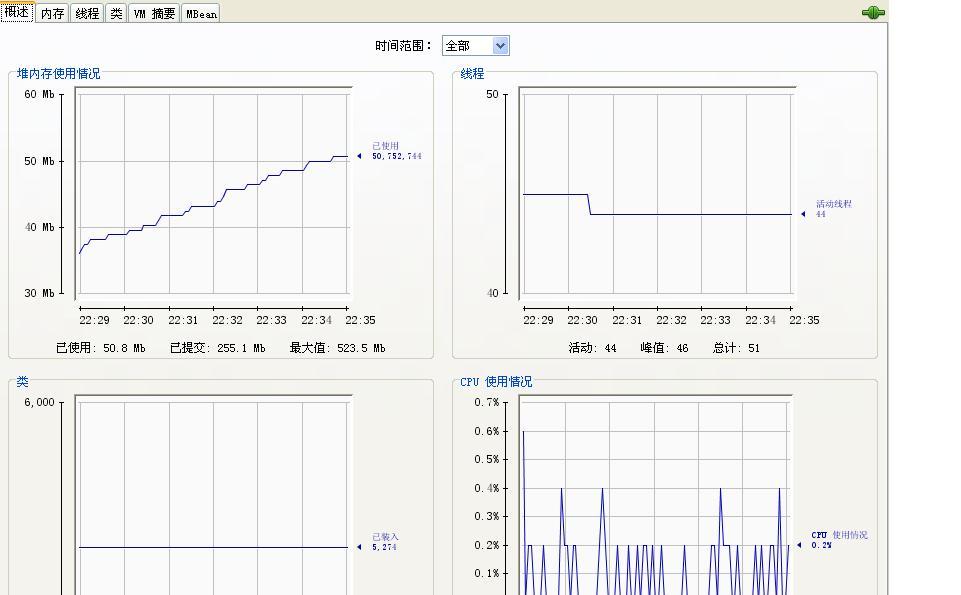
Jconsole,Java Monitoring and Management Console。
java監控和管理控制臺,從java5開始,在JDK中提供。
用于對JVM中內存,線程、類和虛擬機的運行情況等的監控。提供了本地監控和遠程監控兩種功能。
[root@host bin]# ./jps
17515 Standalone
1487 Jps
jmap是一個可以輸出所有內存中對象的工具,甚至可以將VM 中的heap,以二進制輸出成文本。使用方法 jmap -histo pid。如果連用 SHELL jmap -histo pid > a.log可以將其保存到文本中去(windows下也可以使用),在一段時間后,使用文本對比工具,可以對比出GC回收了哪些對象。jmap -dump:format=b,file=f1 3024可以將3024進程的內存heap輸出出來到f1文件里。
jmap的常用命令:
(1)jmap -finalizerinfo JVM的進程號
這個表示有多少對象正在finalization隊列中,等待finalizer thread進行finalizer,對于finalizer的原理
例如:
[root@tomy tomcat] # /usr/java/latest/bin/jmap -finalizerinfo  25757
Attaching to process ID 25757, please wait...
Debugger attached successfully.
Server compiler detected.
JVM version is 14.0-b16
Number of objects pending for finalization: 0
(2)jmap -heap JVM的進程號
打印堆的使用情況,以及GC采用什么垃圾回收器
例如:
[root@labs-dev01 tomcat]# /usr/java/latest/bin/jmap -heap  25757
Attaching to process ID 25757, please wait...
Debugger attached successfully.
Server compiler detected.
JVM version is 14.0-b16
using thread-local object allocation.
Parallel GC with 2 thread(s)
Heap Configuration:
   MinHeapFreeRatio = 40
   MaxHeapFreeRatio = 70
   MaxHeapSize      = 402653184 (384.0MB)
   NewSize          = 1048576 (1.0MB)
   MaxNewSize       = 4294901760 (4095.9375MB)
   OldSize          = 4194304 (4.0MB)
   NewRatio         = 8
   SurvivorRatio    = 8
   PermSize         = 16777216 (16.0MB)
   MaxPermSize      = 67108864 (64.0MB)
Heap Usage:
PS Young Generation
Eden Space:
   capacity = 42598400 (40.625MB)
   used     = 21145576 (20.165992736816406MB)
   free     = 21452824 (20.459007263183594MB)
   49.63936673677885% used
From Space:
   capacity = 1048576 (1.0MB)
   used     = 652736 (0.62249755859375MB)
   free     = 395840 (0.37750244140625MB)
   62.249755859375% used
To Space:
   capacity = 1048576 (1.0MB)
   used     = 0 (0.0MB)
   free     = 1048576 (1.0MB)
   0.0% used
PS Old Generation
   capacity = 357957632 (341.375MB)
   used     = 23543768 (22.453086853027344MB)
   free     = 334413864 (318.92191314697266MB)
   6.577249902021924% used
PS Perm Generation
   capacity = 24903680 (23.75MB)
   used     = 24817640 (23.667945861816406MB)
   free     = 86040 (0.08205413818359375MB)
   99.65450889185855% used
(3)jmap -dump:file= JVM的進程號(java5版本不支持這個參數)
[root@labs-dev01 tomcat]# /usr/java/latest/bin/jmap -dump:file=heap.bin  -F 25757
Attaching to process ID 25757, please wait...
Debugger attached successfully.
Server compiler detected.
JVM version is 14.0-b16
Dumping heap to mashup ...
Finding object size using Printezis bits and skipping over...
Finding object size using Printezis bits and skipping over...
Finding object size using Printezis bits and skipping over...
Finding object size using Printezis bits and skipping over...
Finding object size using Printezis bits and skipping over...
Finding object size using Printezis bits and skipping over...
Finding object size using Printezis bits and skipping over...
Finding object size using Printezis bits and skipping over...
Finding object size using Printezis bits and skipping over...
Finding object size using Printezis bits and skipping over...
Heap dump file created
dump下來的二進制文件,需要用專門的工具進行查看,sun提供了jhat工具進行查看:
[root@tomy tomcat]# /usr/java/latest/bin/jhat heap.bin
Reading from heap.bin...
Dump file created Wed Apr 14 08:57:06 GMT+00:00 2010
Snapshot read, resolving...
Resolving 443412 objects...
Chasing references, expect 88 dots........................................................................................
Eliminating duplicate references........................................................................................
Snapshot resolved.
Started HTTP server on port 7000
Server is ready.
由上面可以看到,jhat查看器,是啟動了7000端口,讓客戶端可以通過web方式進行查看,dump出來的內容包含:
1.所有在內存中的類信息
2.所有類的實例數目
3.GC的root set
客戶端可以通過瀏覽器訪問http://ip:7000就可以訪問到heap里面的內容了。
在Java開發工具中,Java內存監控工具只是其中一種,大家在以后還會接觸到更多,可要好好了解一下哦。
 Java實驗班
0基礎 0學費 15天面授
 Java就業班
有基礎 直達就業
 Java夜校直播班
業余時間 高薪轉行
 Java在職加薪班
工作1~3年,加薪神器
 Java架構師班
工作3~5年,晉升架構
提交申請后,顧問老師會電話與您溝通安排學習

官方微信

官方抖音


 京公網安備 11030102010736號